Methods
For each of our research objectives we have conducted separate experiments. On this page we describe the experimental methods for our second objective:
2. Does spruce have chilling requirements when it grows in maritime climates with milder winters?
2. Does spruce have chilling requirements when it grows in maritime climates with milder winters?
Experimental Design
|
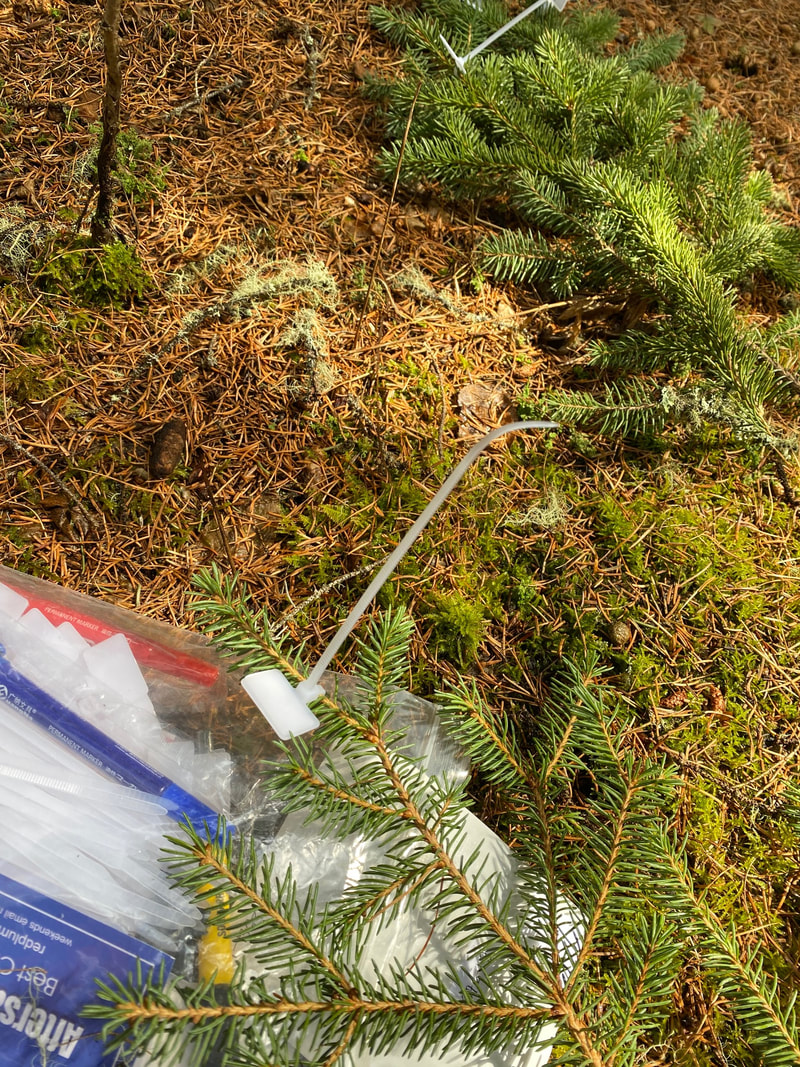
In the chilling requirement experiment 8 provenances were selected to increase the sample size of each provenance (Figure 1). Provenances were selected to capture expected differences between maritime and continental populations and between northern and southern populations as seen for other species (Leinonen, 1996, Nienstaedt, 1967, Thibault et al., 2020). A single branch was selected from three trees in each block of the chosen provenances during each collection session. Collection occurred during four periods between September 18 and October 31, 2021. The stratified collection periods ensure the trees received a variation in outdoor chilling.
|
|
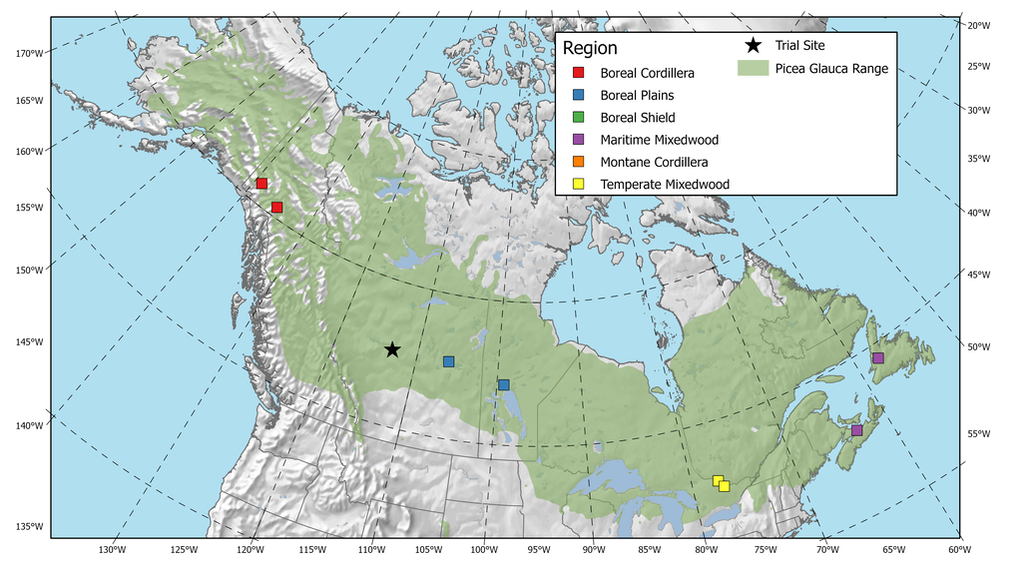
Figure 1 - Map showing the locations of the provenances of trees samples in this experiment. Origin points are colored according to the province they belong to.
Following collection branches were transferred indoors into glass jars filled with water that was refreshed once a week. Indoor heating was monitored using an Elitech RC-4HC Temperature and Humidity Data Logger. On observation days buds on individual branches were rated using a standardized scale for white spruce (Dhont et al., 2010). For the chilling requirements experiment, a light was setup to create a long photoperiod (16 hours) to trigger budbreak in the absence of complete chilling (Nienstaedt, 1966). Light experienced by buds ranged from 2 to 48 μmol m-2-1. Observation of budbreak stage began 2-3 weeks after branches were moved indoors. Budbreak stage was recorded every other day until the branches died.
Statistical Analysis
Our statistical analysis for this objective had several parts. First, we determined the differences between these regions for the amount of time it takes for twigs to reach budburst when they are exposed to no chilling. We focused on this day because we expect to see the greatest differences in heat-sums at this date if there is a chilling requirement. To test for differences between regions we used an ANOVA test to compare the difference in time to budburst for the four regions when the twigs did not experience chilling. We followed up this analysis by constructing confidence intervals for the means.
We also examined the difference between the heat-sums required when the twigs were exposed to no chilling and when they had adequate chilling. This tells us the magnitude of change in budburst that occurs when no chilling is present. We used a student’s t-test to determine whether there was a difference and then constructed confidence intervals to quantify that difference.
Some of the provenances sampled displayed a non-linear relationship between chilling days and time to budburst. For these provenances we fit non-linear equations to these lines to approximate the relationship.
